The Best, free Support and Resistance indicator MT4 download
Double in a Day Tool
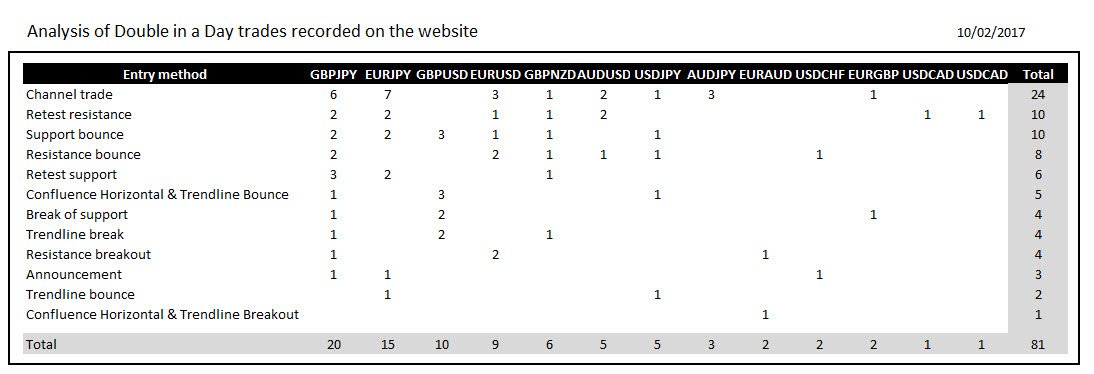
One of the areas we cover in the Double in a Day finding Great Entries Course Is support and Resistance. As you can see from this table all successful DIAD trades have an element of support and resistance as the main reason for entering.
Now many traders battle to see support and resistance so we have been searching the internet for free support and resistance indicators. We have found one that identifies short term support and resistance.
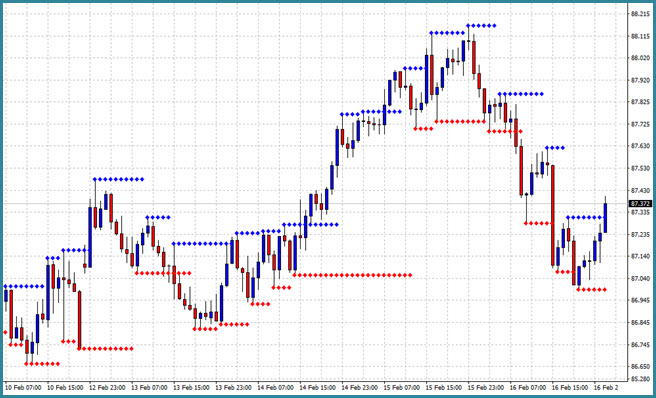
The concept is a bit different to the traditional historical support and resistance lines as only the most recent price action is taken into account.
So when looking at the chart above you will see that the indicator establishes say a level of support. That support will stay in place until another level is determined. The new level the “takes over” from the old level and repeats the process. This happen in an uptrend and in a down trend. Pretty neat.
In the Mt4 Forex chart shown the blue lines represent resistance and the red one support. Often a bounce off a blue or red line results in a long candle (a quick move). Sometimes a break of support results in a long Forex candles. Long candles are what we are hunting when trading the Double in a Day technique.
There are a few ways you can use this indicator.
When the support and resistance lines align on a horizontal basis that starts showing a major area of support and resistance
The indicator can confirm your own view of support and resistance
The levels make great place to reference stops and targets to
They show trends. A uptrend for instance when both the support and resistance lines are moving higher
Download this great indicator here
This indicator is a free indicator that was sourced from the internet for use by our clients and is not an Expert4x indicator. We cannot offer any technical support for it.

