Introduction
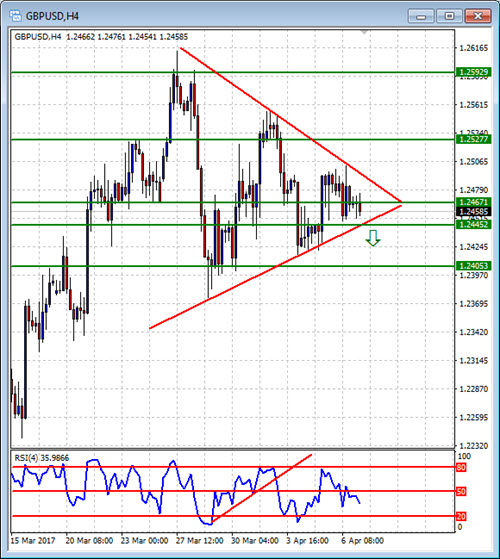
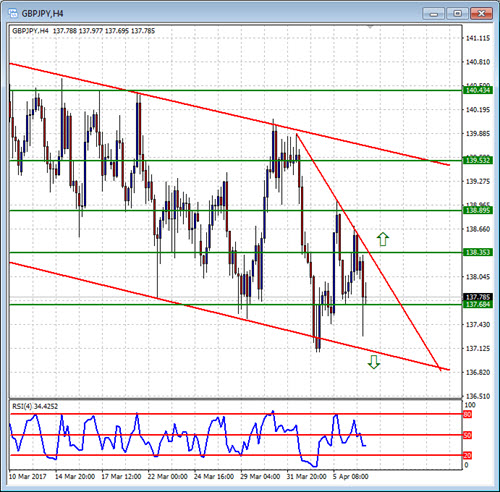
The charts below are provided for educational purposes and for debate. They are only available to traders who have completed Foundation phase of the DIAD Great entries Course. They are provided to compliment your own trading and not replace it – please use your own judgement to find entries based on support and resistance.
The entries are meant for Double in a Day EA entries using a 100 pip target so are not relevant to module 2 where 40 pip entries with 20 pip stops are being traded. The chart are only provided for interest at this stage. It represents the direction aspects of Double in a Day trading will be moving.
The following currencies are being used as they have produced the most Double in a day trades in the past GBPJPY, EURJPY, GBPUSD.
I have decided to only publish 3 charts as the purpose of the course is to encourage your own trading perspectives – publish 3 may already be influencing your own perspective so we will see how the next week goes. Please only refer to these charts once you have completed your own analysis work on our charts
Click here to see the analysis of the last 81 DIAD entry methods > PAST DIAD Trades
Please note as part of this analysis I have added the RSI. This give some direction as to a direction bias. Please make any comments or remarks using the comments facility below


